Predictive Analytics
Process and Methodology

The approach
Predictive analytics is a data-driven approach to forecasting future events and trends, and it is becoming an increasingly valuable tool for businesses in a wide range of industries. By analyzing historical data and patterns, predictive analytics can help organizations make informed decisions, identify opportunities, and minimize risks. At our company, we offer comprehensive predictive analytics services to help businesses make sense of their data and gain valuable insights into their operations.
Our predictive analytics solutions include data preparation and cleaning, model development, model validation, and ongoing performance monitoring. We work with our clients to understand their unique business challenges and objectives, and we tailor our solutions to meet their specific needs. Our team of experienced data scientists and analysts use state-of-the-art tools and techniques to build models that are accurate, reliable, and scalable.
Whether you need to predict customer behavior, forecast demand, or optimize your supply chain, our predictive analytics services can help. We provide our clients with actionable insights that enable them to make better decisions, reduce costs, and improve their bottom line. Contact us today to learn more about how we can help you leverage the power of predictive analytics to drive your business forward.
guidance
Navigating a strategic roadmap
Data Collection
The first step in predictive analytics is to collect relevant data. This includes identifying and gathering structured and unstructured data from various sources such as internal systems, external databases, social media, and other online platforms. Once the data is collected, it is cleaned, transformed, and processed to ensure that it is accurate and consistent. This step is crucial as the accuracy and quality of the data determine the effectiveness of the predictive models.
Data Exploration and Visualization
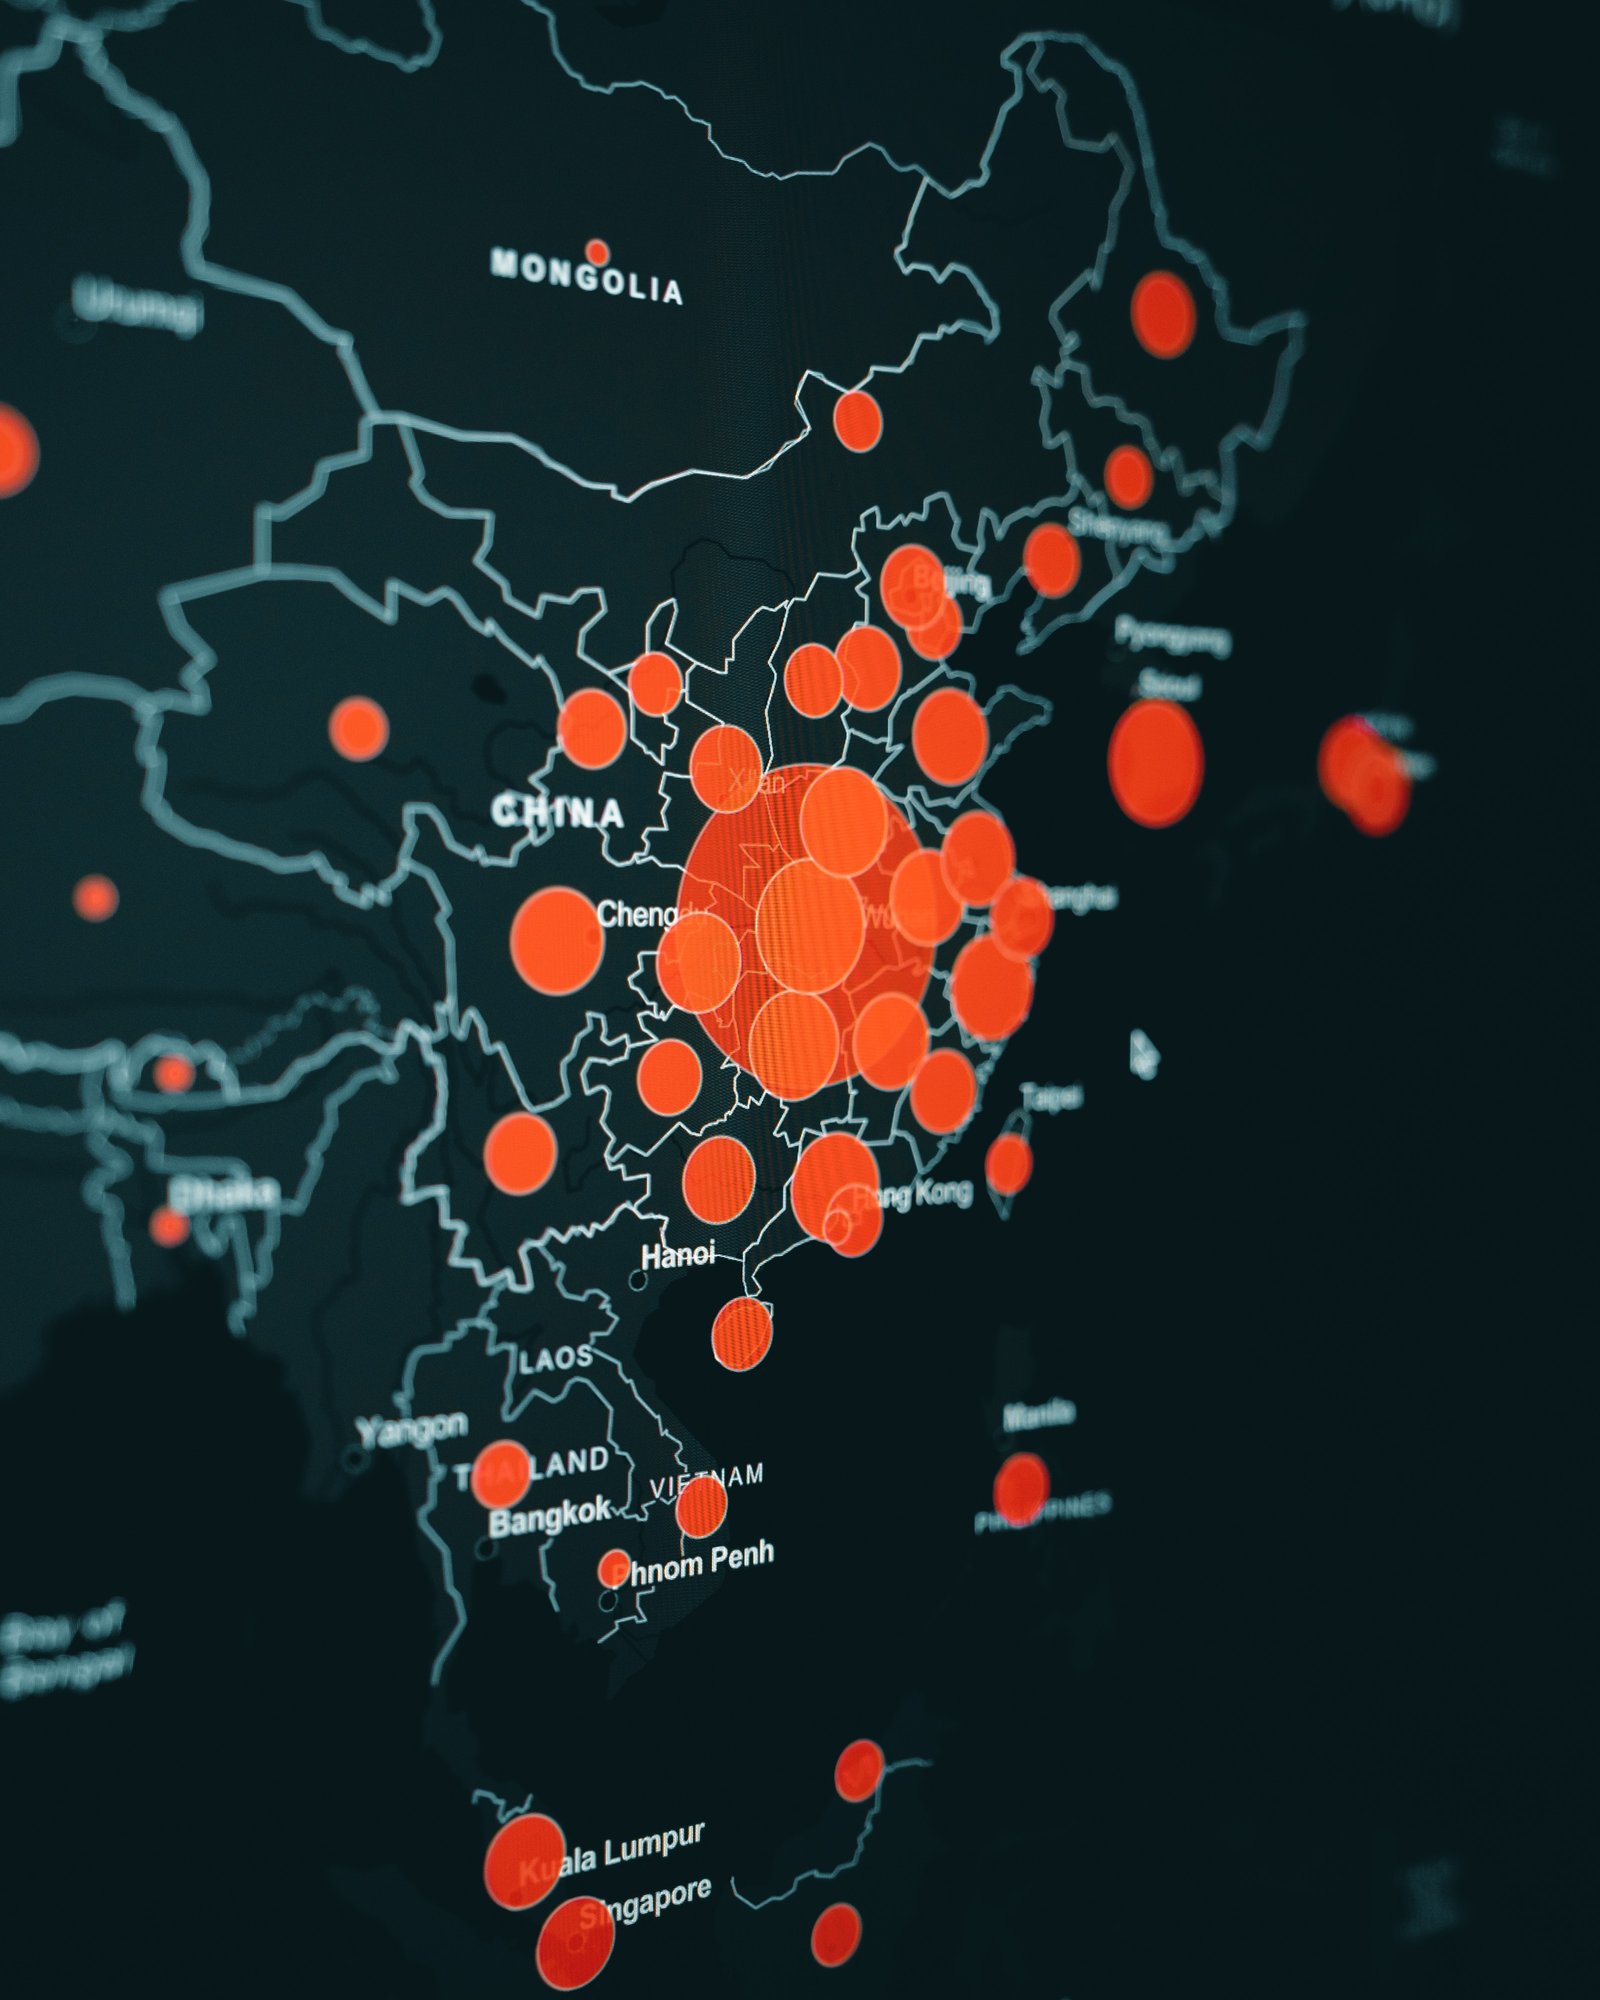
In this step, the collected data is analyzed to identify patterns and trends that can help in making predictions. Data exploration involves examining the data to understand the relationships between different variables and identifying any outliers or anomalies. Data visualization tools such as charts, graphs, and dashboards are used to present the data in a meaningful way, making it easier to identify patterns and relationships.
Model Evaluation and Refinement
Once the models are developed, they are evaluated to determine their accuracy and effectiveness in predicting outcomes. This involves comparing the predicted outcomes with the actual outcomes to measure the model's performance. If the model's performance is not satisfactory, it is refined by adjusting the model parameters, adding more data, or using a different model.
Deployment and Monitoring
In the final step, the predictive models are deployed to make predictions on new data. This involves integrating the models into business processes and systems to automate the decision-making process. Once deployed, the models are monitored to ensure that they are still accurate and effective. Any changes in the data or business environment may require the models to be retrained or refined.
